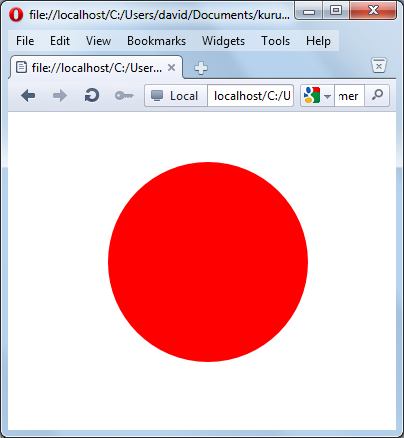
<svg
xmlns="http://www.w3.org/2000/svg">
<circle r="50"/></svg>

|
|
| circle1.svg | |
|
 |
| circle2.svg | |
<ellipse ry="55" rx="100" cy="80"
cx="150"  stroke="black" stroke-width="3" fill="none"/>
|
|
| ellipse1.svg | |
|
|
| fourVenn1.svg | |
|
|
| Venn five | |
|
|
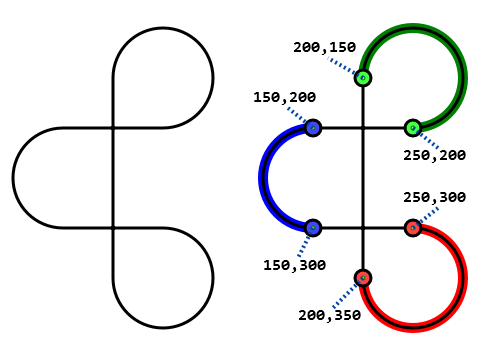
| Vcoo.svg | |
<path d="M 30,10 L 50,90 70,10"
fill="none" stroke="black" stroke-width="8"/>
<path d="M 30,10 50,90 70,10"
fill="none" stroke="black" stroke-width="8"/><path d="M 30 10 50 90 70 10"
fill="none" stroke="black" stroke-width="8"/>
|
 |
| tanglecoo.svg | |
|
|
| Eightcoo.svg | |
| vplay.svg |